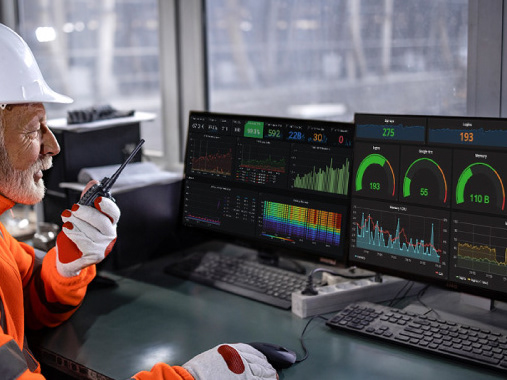
The real time processing application detects events and supports automatic and manual processing, delivering insights into production efficiency for faster decision-making and lower operational costs. The application is projected to drive significant revenue and customer growth.
Due to a Non-Disclosure Agreement (NDA), I am unable to share specific details about this project, including research insights, design iterations, and final deliverables. If you'd like to discuss my approach and problem-solving process in more detail, I’d be happy to connect.
The Process
From Insights to Impact: BTS of the Solution
Gathering Business Requirements
Business requirements were gathered through a Product Discovery Workshop, where key stakeholders aligned on goals, challenges, and user needs. A Vision Board was created to define the product direction, ensuring a clear strategy for delivering value to both users and the business.
Prioritizing Solutions
Potential solutions were evaluated and prioritized using an Impact vs. Effort Matrix, ensuring that high-impact, low-effort solutions were addressed first to maximize efficiency and business value.
Studying the Complex Workflow
To understand the problem space, the complex engineering workflow was analyzed through user interviews and user flow mapping, capturing key steps, pain points, and decision-making processes.
Ideation and Design Critique Sessions
During the ideation phase, pencil sketching was used to explore solutions for each user flow within the app. After wireframing, a Black Hat session was conducted as a design critique method, challenging assumptions and identifying potential flaws to refine the user experience.
Moderated Usability Testing
Moderated usability testing was conducted to observe user interactions in real-time, allowing for deeper insights through direct feedback, guided tasks, and clarifying questions to refine the design.
Uncovering opportunities
Stakeholder meetings helped uncover missed opportunities by aligning business goals with user needs, identifying gaps in the current experience, and refining the product strategy for greater impact.
Adding New Features - Operational Flags
To define operational flags and warnings, requirements were gathered to understand their criticality and impact. A tree diagram was used to structure and group them logically, ensuring a clear hierarchy, while design decisions focused on the most effective way to display them for quick user comprehension.
Constraints and Tradeoffs
The UX Tug-of-War
▶︎ There was a need to reduce the number of steps without compromising on accuracy or intuitiveness for the user and this was achieved through automating wherever possible.
▶︎ Simplifying the UI required incorporating additional components, potentially increasing complexity while striving to maintain usability and clarity.
▶︎ The requirement to display all results at once, which led to an overwhelming amount of information on the screen, potentially hindering user comprehension and focus. The design approach of segmenting the results cards reduced this problem to a great extent.
Here's How We Defined Success
To measure the impact of the UX design, clear success criteria aligned with user needs and business goals were established. While user satisfaction was assessed through feedback and usability testing, metrics such growth in number of customers and adoption rates indicated the overall value of the design. Ultimately, a successful outcome meant a seamless, intuitive experience that aligned with stakeholder expectations and drove tangible business growth.
Takeaways
▶︎ Involving R&D in the design process early on for data heavy complex algorithmic applications is necessary.
▶︎ Frequent stakeholder meetings for continuous design reviews and gathering new opportunities, ensured alignment throughout the project and allowed for timely adjustments to meet both business and user needs.


